In this guide, we’ll walk through how to use the built-in Developer Tools (F12) in Chrome, Edge, and Firefox to inspect code, debug issues, and fix CSS styling problems. This Browser dev tools tutorial (F12) will help you master these essential tools.
Table of Contents:
- Accessing Developer Tools
- Inspecting Elements (HTML/CSS)
- Debugging JavaScript
- Fixing CSS Issues
- Mobile Emulation
- Debugging Network Issues
Please note all screenshots taken for this tutorial were made on Chrome browser, other devtools like Microsoft Edge, Firefox or Safari should have similar names and locations.
1. Accessing Developer Tools
All major browsers have similar developer tools that can be accessed with a single keystroke:
- Chrome: Press
F12orCtrl + Shift + I - Edge: Press
F12orCtrl + Shift + I - Firefox: Press
F12orCtrl + Shift + I
Note: The first time, a popup may appear asking you to open the DevTools. You can check ‘Remember this decision’ and select ‘Open tools’ to proceed.
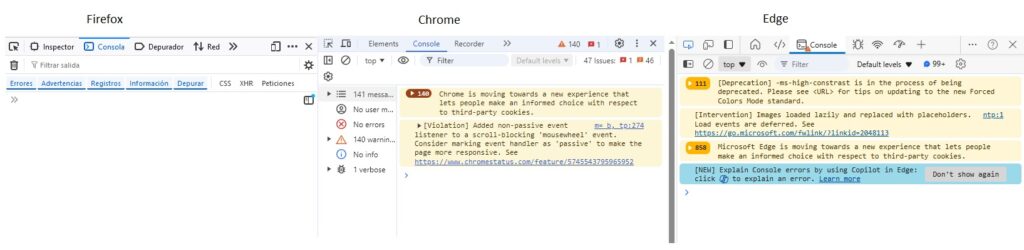
Once opened, you’ll see a panel usually docked at the bottom or right of your browser window. This panel includes multiple tabs like Elements, Console, Sources, and Network.
2. Inspecting Elements (HTML/CSS)
One of the core features of DevTools is the ability to inspect the structure of a webpage. This is especially useful when debugging layout or styling issues.
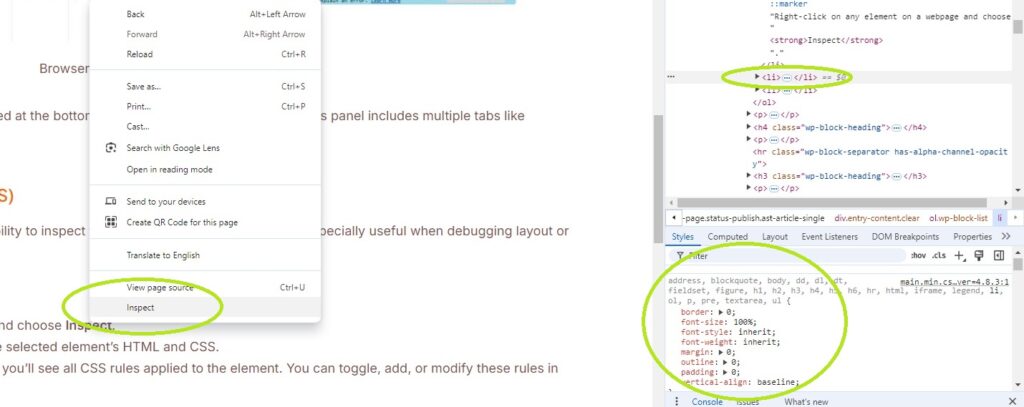
Steps to Inspect an Element:
- Right-click on any element on a webpage and choose Inspect.
- The Elements tab will open, highlighting the selected element’s HTML and CSS.
- In the Styles panel on the right (or bottom), you’ll see all CSS rules applied to the element. You can toggle, add, or modify these rules in real time.
Pro Tip:
You can hover over elements in the HTML tree, and DevTools will highlight them in the browser view, showing their exact size, margin, and padding.
3. Debugging JavaScript
DevTools also provide powerful debugging tools for JavaScript code. This helps in tracking down errors, setting breakpoints, and stepping through code.
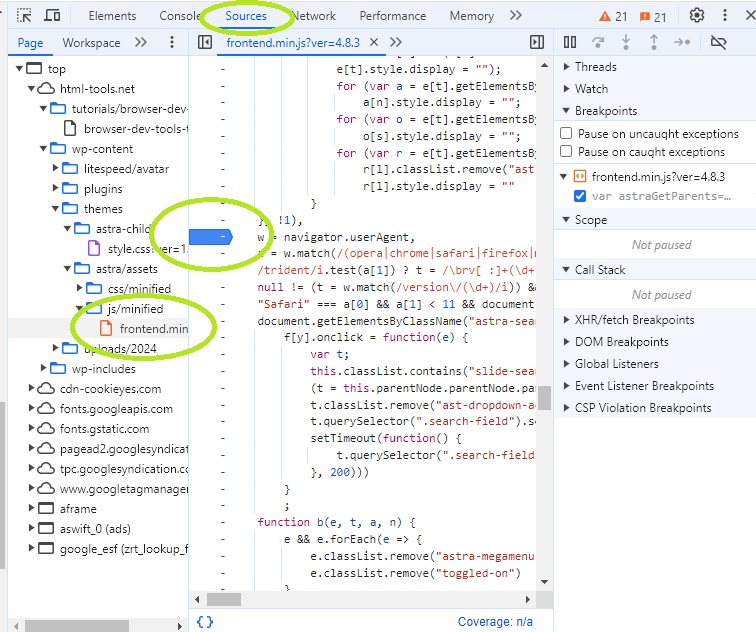
Steps to Debug JavaScript:
- Go to the Sources tab.
- Find the JavaScript file you want to debug in the left panel.
- Set breakpoints by clicking on the line number where you want the code to pause. Refresh your page (F5) to trigger the content in the JS.
- When the code execution reaches this line, it will stop, allowing you to inspect variables and step through the code.
- Remember to remove your breakpoints once the debugging is done, otherwise the page will be stopping on every refresh or load.
Console for Debugging:
The Console tab is useful for logging messages, errors, and testing small code snippets.
- Use
console.log()to print variables or messages in the Console tab. - View any errors or warnings in the Console as well.
4. Fixing CSS Issues
If a webpage isn’t displaying correctly, CSS is often the culprit. With DevTools, you can quickly identify and correct styling problems.
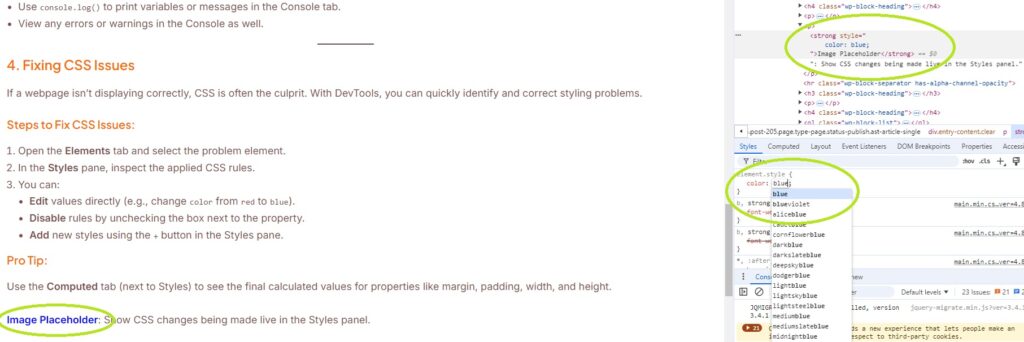
Steps to Fix CSS Issues:
- Open the Elements tab and select the problem element.
- In the Styles pane, inspect the applied CSS rules.
- You can:
- Edit values directly (e.g., change
colorfromredtoblue). - Disable rules by unchecking the box next to the property.
- Add new styles using the
+button in the Styles pane.
- Edit values directly (e.g., change
Pro Tip:
Use the Computed tab (next to Styles) to see the final calculated values for properties like margin, padding, width, and height.
5. Mobile Emulation
Testing how your website looks and functions on mobile devices is critical. Nowadays, there are developing technics that prioritize mobile view developing vs screen developing, as accessing through the phone is more common than screen device like PC, mac, etc. DevTools provides a built-in mobile emulator that simulates different screen sizes and devices.
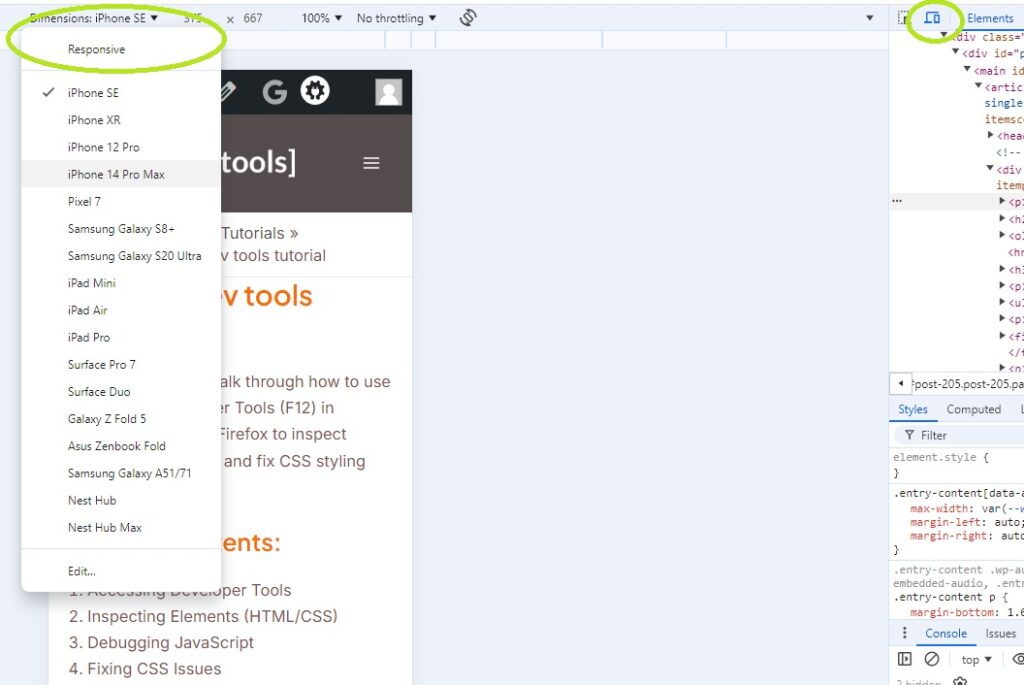
Steps for Mobile Emulation:
- In the Elements tab, click the Toggle Device Toolbar (a small phone and tablet icon in the top-left corner).
- Select a device from the drop-down (e.g., iPhone X, Galaxy S9).
- The webpage will resize to simulate the chosen device.
Pro Tip:
You can also change the orientation (portrait/landscape) by clicking the rotate button in the Device Toolbar.
6. Debugging Network Issues
If you’re facing issues with loading resources, DevTools offers the Network tab, which tracks all network requests made by the page (such as images, scripts, stylesheets, etc.).
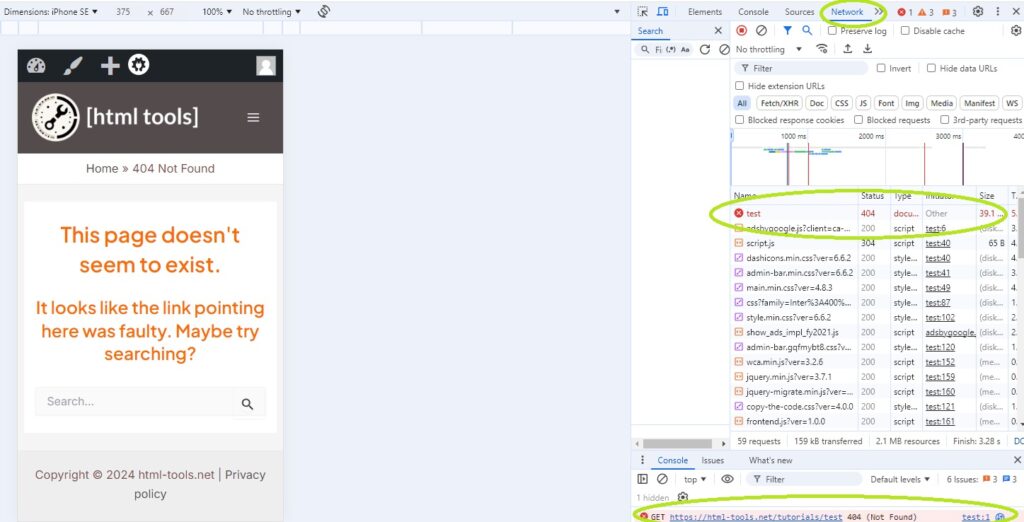
Steps to Debug Network Requests:
- Open the Network tab.
- Reload the page. You’ll see a list of all requests made.
- Click on any request to view details like headers, response, and timings.
- Look for errors such as 404 (file not found) or 500 (server errors).
Pro Tip:
Use filters to narrow down requests (e.g., filter by CSS, JS, Images) to quickly find the resource causing issues.
Conclusion
By mastering the DevTools in Chrome, Edge, and Firefox, you can significantly improve your workflow as a developer, whether you’re debugging JavaScript errors, fixing CSS issues, or testing how your site looks on different devices. Start experimenting with these powerful tools, and soon, you’ll be debugging and tweaking your code like a pro!